Earthquake Frequency in Indonesia
INFOGRAPHICS
5/12/2024
Indonesia's geographic position on the Pacific "Ring of Fire" makes it one of the most earthquake-prone regions globally, as it sits atop several intersecting tectonic plates. Specifically, the archipelago straddles the boundaries of the Pacific Plate, the Indo-Australian Plate, and the Eurasian Plate, where complex interactions such as subduction, collision, and lateral sliding occur. These interactions are a primary driver of the region's frequent seismic activity. The subduction of the Indo-Australian Plate beneath the Eurasian Plate, for instance, not only triggers regular earthquakes but also contributes to the region’s significant volcanic activity.
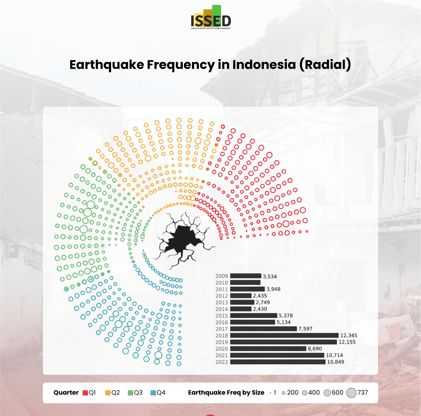
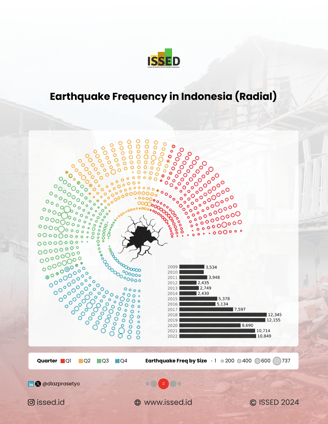
This "Earthquake Frequency in Indonesia (Radial)" dashboard provides an innovative and detailed visualization of earthquake occurrences across the Indonesian archipelago from 2009 to 2022. This interactive tool uses a radial chart to illustrate weekly seismic activities within each year, effectively mapping out the temporal distribution of earthquakes. Each circle in the radial layout represents a week. The size of each circle represents the number of earthquakes that occurred each week, with bigger circles showing a higher frequency, making it easy to identify periods of high seismic activity.
A closer look at the annual data reveals significant variations in the number of earthquakes over the years. For instance, 2018 and 2019 stand out with exceptionally high numbers of recorded seismic events, totaling 12,345 and 12,155 earthquakes respectively. This spike in earthquake activity highlights the dynamic and unpredictable nature of geological forces under Indonesia. In contrast, other years like 2012 reported much lower figures, with only 2,435 earthquakes, illustrating the fluctuating seismic patterns that can occur from year to year. The dashboard also breaks down earthquake occurrences by quarters, with each quarter represented by a different color. This method facilitates an easy comparative analysis of seismic activity across different times of the year, revealing any seasonal trends or anomalies in earthquake patterns. Such detailed temporal segmentation is invaluable for researchers and disaster management professionals who need to prepare for periods historically prone to increased seismic activity.
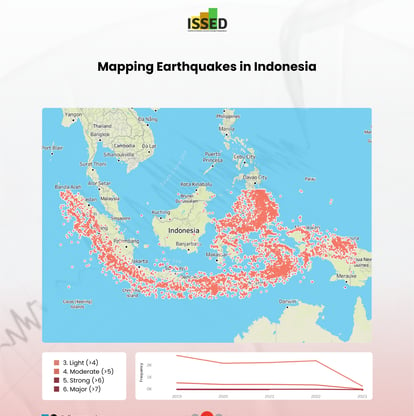
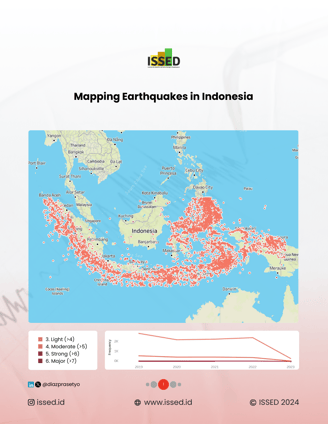
After seeing the frequencies throughout each year, it is also important to identify the magnitude and location of each earthquake. This "Earthquake in Indonesia" dashboard provides an even more granular look at the seismic challenges. It employs a map to pinpoint the locations of earthquakes across Indonesia, color-coded by magnitude, ranging from light (magnitude 4+) to major (magnitude 7+). This mapping is crucial for identifying specific regions where infrastructure needs to be built or reinforced to withstand potential seismic impacts. Accompanying the map, a frequency graph delineates the number of significant seismic events over the years 2019 to 2023. The line graph indicates fluctuations in seismic activity, with peaks suggesting periods of increased tectonic movement. This trend data is essential for scientists and policymakers alike, as it assists in predicting future seismic activity and planning for emergency responses and resource allocation. The graph's visual simplicity complements the detailed map, providing a clear, at-a-glance understanding of temporal seismic patterns.
These dashboards not only serve as a critical tool for geoscientists and researchers studying seismic activities but also play an essential role in disaster preparedness for local governments and communities. By making complex earthquake data accessible and understandable, it enhances the ability of these stakeholders to implement effective safety measures and response strategies. This can lead to better-informed decisions, potentially reducing the impact of earthquakes and improving the resilience of communities throughout Indonesia’s diverse and expansive islands.
Interactive dashboard (here)
Interactive dashboard (here)